Understanding the Physics of Airflow in High Density Environments
Last week we launched an article series on the challenges of keeping IT equipment cool in high density environments. This week, we continue by looking at the physics of airflow and ASHRAE thermal guidelines.
Get the full report.
The basic physics of using air as the medium of heat removal is well known. This is expressed by the basic formula for airflow (BTU=CFM x 1.08 x ∆T °F), which in effect defines the inverse relationship between ∆T and required airflow for a given unit of heat. The traditional cooling unit is designed to operate based on approximately 20°F differential of the air entering the unit and leaving the cooling unit (i.e., delta-t or ∆T). For example, it takes 158 CFM at a ∆T of 20°F to transfer one kilowatt of heat. Conversely, it takes twice that amount of airflow (316 CFM) at 10°F ∆T. This is considered a relatively low ∆T, which increases the overall facility cooling unit fan speeds to deliver more air flow to ITE.
The left side of Table 2 below shows the results of the required airflow in relation to the ∆T of the IT equipment. The right side of the table shows the airflow per supply floor over a range of power level of 5-15 kW.
Table 2 – ITE Airflow Requirement vs Delta and corresponding CFM per supply floor tile
*Note: For purposes of these examples, we have simplified the issues related regarding latent vs. sensible cooling loads (dry-bulb vs. wet-bulb temperatures). The airflow table is based on dry-bulb temperatures.
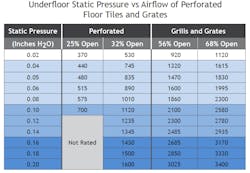
In order to deliver the higher airflow for raised floor systems, higher underfloor static pressures are required to provide the pressure for the perforated tile or floor grate supplying air to the cold aisle. In the majority of data centers the cold aisle is typically two tiles wide, which means that there is one supply tile per ITE cabinet. There is a wide range of perforated floor tiles, grates and grills— as listed in Table 3.
Table 3 – This table represents a generic range of values of commonly available products without adjustable dampers—it is not manufacturer specific. The CFM ratings are for units without adjustable dampers. Dampers would reduce the CFM rating.
While not an absolute statement, typical under floor systems average pressures range from 0.04-0.08 inches H2O. These pressures are just a stated design average, in an operating data center underfloor pressure can vary widely (-100% to +100%) and are affected by many factors.
Of course, the higher the power density of an ITE cabinet or cluster of cabinets, the higher the CFM required per tile. As a result, underfloor pressures need to increase in order to deliver the required CFM. Moreover, as can be seen in Table 3, an increase in static pressure does not directly result in a proportional increase in airflow CFM. For example, doubling static pressure (0.04 to 0.08 Inches H2O) only results in an approximately 130-145% increase in CFM per tile. (As highlighted in Table 4).
Table 4 – Doubling static pressure (0.04 to 0.08 Inches H2O) only results in an approximately 130-145% increase in CFM per tile.
Capture Index
While Table 3 shows the projected CFM performance in relation to static pressure, it should not be assumed that all the airflow leaving the floor tile enters the IT cabinet. The capture index (also called capture ratio) represents the percentage of the air leaving the tile to the amount of air entering the face of the IT cabinet. However, this does not guarantee that all the air is getting to the air intake of the ITE inside the cabinet (See the Mind the Gaps section below).
For uncontained cold-aisles, there is a significant percentage of cold supply airflow which does not reach the face of the IT cabinet (reducing the net CFM and capture ratio). In addition, there is mixing of hot and cold air, all of which reduces the overall supply of cool air to the cabinet, as well as increasing ITE air intake temperatures. Therefore, it is common practice to deliver higher airflow (oversupply), to help reduce mixing, which causes hotspots. Of course, higher airflow requires more underfloor pressure, and also increases airflow velocity in a given tile. This oversupply also increases the fan energy of the facility cooling units required to cool the rack.
While a relatively complex subject, in general, the higher the velocity the greater the impact. This is often overlooked; however an accurate CFD model will show the impact of this.
However, the increased pressures also increase leakage in several categories:
- Cable opening in Floor
- Seams between solid floor panels
- Gaps
- Under the bottom of ITE Cabinets
- Between ITE Cabinets
- Inside IT Cabinet
The leakage can become a significant factor as pressures increases, which in turn requires cooling unit fans to increase speed and raise the energy required to cool the racks.
The velocity of the airflow coming from the supply floor tile or grate can also influence the amount of air actually entering the ITE cabinet, as well as drawing unwanted warm air if there are gaps under the bottom of IT cabinets. While a relatively complex subject, in general, the higher the velocity the greater the impact. This is often overlooked; however an accurate CFD model will show the impact of this.
The percentage open rating for a floor tile or grate will directly affect the discharge velocity of the air for a required amount of airflow. It is also influenced by the type of grate or grill (directional louvers or undirected).
Table 5 – Example of the tile rated percent open vs velocity (figures are approximations — not manufacturer specific)
Mind the Gaps
As the velocity of the air increases the impact of the Venturi effect, which comes into play if there are gaps under the cabinet. It creates a negative air pressure drawing warm airflow though the gaps under the bottom of the rack. These gaps can range from one half-inch to 2 inches high, allowing warm air to be drawn beneath the cabinet and mix with the cold supply air coming up from the tile in front of the cabinet. Table 6 shows the open area for an under- cabinet gap, based on its size. While there are several variables that determine the relative differential pressure at the gap area, in general the larger the area and velocity, the greater the CFM drawn under the cabinet.
Individually and collectively, these gaps can be a significant cause of hot air mixing with the supply air in cold aisle containment, increasing the actual intake temperatures reaching the ITE. This issue becomes more severe as more air flow is required to meet increase power levels.
Table 6 – Approximate open area for an under-cabinet gap, based on gap height.
Less obvious and often overlooked, but potentially as significant, are the gaps between cabinets as shown in Table 7. These gaps between the cabinets can also significantly impact airflow between the hot and cold aisles. There are various devices which can address this problem, some more effective than others. In general, devices that can fully adapt to various size inter-cabinets spaces, such as those with a flexible compressible and expandable material, are more effective at fully sealing the vertical gaps.
Table 7 – Open area of gaps between cabinets (figures rounded for clarity)
Understanding ITE Dynamic Delta-T
Moreover, modern IT equipment has a highly variable airflow dependent on its operating conditions, as well as its computing load. This means that ∆T may vary from 10°F to 40°F during normal operations as ITE fans increase or decrease speed in response to intake temperatures and IT computing loads. This in itself creates airflow management issues resulting in hotspots for many data centers that are not designed to accommodate this wide range of varying temperature and airflow differentials. This can also limit the power density per rack if not accounted for.
There are various levels of containment that influence the severity of this potential issue. This can be quantified by monitoring pressure in contained cold aisles.
Unexpected Consequences of Energy Star Servers
Virtually all modern servers generally control the speed of their fans in relation to air intake temperatures and processing loads. In the case of Energy Star rated servers, one of the key parameters is significantly reduced power while at idle, as well as minimizing power draw at 100% computing load. In order to achieve maximum energy reduction, the thermal controls may vary fan speeds more aggressively, resulting in wider range of CFM requirements, as well as delta-T.
ASHRAE Thermal Guidelines
- Recommend and Allowable Environmental Ranges 2004 to 2021
- The Processor Thermal Road Map
- The New H1 Class of High Density Air Cooled IT Equipment
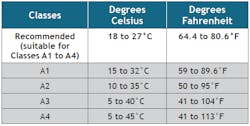
ASHRAE’s TC9.9 Thermal Guidelines for Data Processing Environments (thermal guidelines) have been created with the participation of IT equipment and cooling system manufactures. It is followed by data center designers, owners and operators. The range of recommended temperatures originally was relatively limited (68°F to 77°F), when it was first released in 2004. In 2011, the 3rd edition of the thermal guidelines the recommended temperature range increased to 64.4°F to 80.6°F, it introduced much broader allowable temperatures A1 to A4.
Table 8 – ASHRAE Thermal Guidelines 5th edition 2021 Temperature Ranges
This has effectively remained unchanged (humidity ranges have broadened since them). New data center designs and expected operating conditions for A2 rated ITE has driven data center supply temperatures higher to save energy. Many colocation data center service level agreements (SLA) are based on maintaining ASHRAE recommended range during normal operations, with excursions into the A1 allowable range during a cooling system problem.
In 2021, ASHRAE published a whitepaper the “Emergence-and-expansion-of-liquid-cooling-in- mainstream-data-centers.” The whitepaper included a chart “Air cooling versus liquid cooling, transitions, and temperatures”. This effectively presented a Thermal Road Map for air vs cooled processors based on data provided by chip manufacturers.
The roadmap ranges indicated rapid rises in power requirements and thermal transfer limits from the chip case to the heat sink (air or liquid cooled).
ASHRAE 2021 Reference Card notes that H1 Class ITE should be located in “a zone within a data center that is cooled to lower temperatures to accommodate high-density air-cooled products.”
The thermal roadmap and the 5th edition clearly indicated that as processors went beyond 200 watts, the characteristics of liquid cooling becomes a more thermally effective choice. However, the whitepaper also recognized that many IT equipment users were unwilling or unable to use liquid cooling in existing data centers.
As a result, the new H1 Class of High Density Air Cooled IT Equipment was created to allow operation in air cooled data centers. The H1 allowable range is 59°F to 77°F, however, the recommend temperature range is limited to 64.4°F to 71.6°F. These higher power and power density requirements effectively create much more stringent requirements for ensuring proper airflow to the ITE.
ASHRAE 2021 Reference Card notes that H1 Class ITE should be located in “a zone within a data center that is cooled to lower temperatures to accommodate high-density air-cooled products.”
As noted above, in light of the more restrictive H1 recommended temperature range (64.4°F to 71.6°F) it becomes relatively difficult to implement H1 class IT equipment in the same data center space with raised floor cooling distribution (which normally operates in the ASHRAE recommend range 64.4°F to 80.6°F). However, in many cases the cold air supply temperature is typically much colder 50-60-65°F to allow for airflow mixing. This would allow the use 50 to 65°F underfloor supply air with careful airflow management by means of well-sealed cold aisle containment (see Containment Strategies).
Another solution is to create an isolated zone utilizing complete cold aisle containment, without floor supply tiles or grates. Cooling would be provided by Inrow type units or other forms of close-coupled cold aisle cooling to ensure H1 recommended temperatures.
Download the entire paper, “High Density IT Cooling – Breaking the Thermal Boundaries“ courtesy of TechnoGuard, to learn more. In our next article, we’ll outline a number of containment strategies. Catch up on the previous article here.
