Modeling Tools That Help You Understand Your Data Center’s Lifecycle CO2 Emissions
As we expand data center capacity, the need to comprehend and measure emissions is ever-growing. Modeling tools are a key solution that help to increase awareness of the relationship between data center usage and emissions by identifying and quantifying a data center's carbon footprint over time. Schneider Electric has recently introduced the Data Center Lifecycle CO2e Calculator, a vendor-agnostic and scientifically researched tool that provides accurate and transparent results.
This calculator empowers users to input specific data sets, tailoring them to their unique data centers. Factors such as location (globally), capacity, IT load, rack power density, IT refresh cycle frequency, and physical infrastructure attributes can all be accounted for with ease.
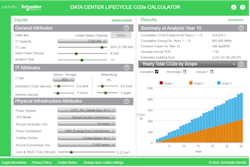
In Figure 1, we observe a hypothetical 3MW data center located in Virginia, with a 90% IT load and a power rack density of 8kW. The input values dictate that servers and storage are refreshed every 4 years, while networking equipment is updated every 5 years. This data center employs a robust 2N power infrastructure, complete with UPS and N+1 diesel backup generators, which operate for 30 hours annually. The UPS boasts industry-standard double conversion efficiency, ensuring optimal power usage.For cooling, the data center utilizes a Chilled Water system in a N+1 configuration, cleverly leveraging 3,000 hours of annual economization to enhance efficiency. The core and shell CO2e intensity, set at 0.23 t/m2, represents the amount of embodied carbon, as per the baseline from the ServerFarm, Whole Building Life-Cycle Analysis Report. It's important to note that all parameters can be effortlessly adjusted by users of this free tool, providing flexibility and customization options.
The 15-year summary analysis reveals that this particular data center example has an overall cumulative carbon footprint of almost 315,000 t of CO2e, while consuming nearly 500,000 MWh of energy at an average PUE of 1.39. The accompanying graph displays the cumulative CO2e effect over 30 years, with Scope 2 and Scope 3 emissions emerging as the most significant contributors.
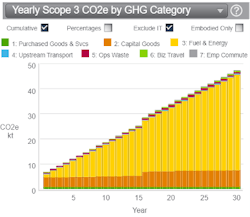
Using the tool, users can explore various aspects, as demonstrated in Figure 2, which showcases Scope 3 emissions by GHG category, excluding IT equipment. The results highlight the substantial GHG impact associated with fuel and energy consumption. This, of course, would differ significantly if the same data center were operated in California, where renewable energy sources play a more substantial role in electricity generation compared to Virginia.The modeling tool provides valuable insight into the GHG emissions profile throughout the data center's lifecycle, whether it's already in operation or in the planning stages. It's essential to note that the tool is not intended for carbon reporting, but rather it offers directionally correct insights to help users make informed decisions, plan effectively, and enhance their operations responsibly.
Carsten Baumann is Director of Strategic Initiatives & Solutions Architect at Schneider Electric. For more information on Scop 3 emissions, download these white papers from Schneider Electric: Recommended Inventory for Data Center Scope 3 GHG Emissions Reporting or Quantifying Data Center Scope 3 GHG Emissions to Prioritize Reduction Efforts.


